

Crypto can lose all of its value and is not protected by FDIC or SIPC insurance. This is education, not investment advice.
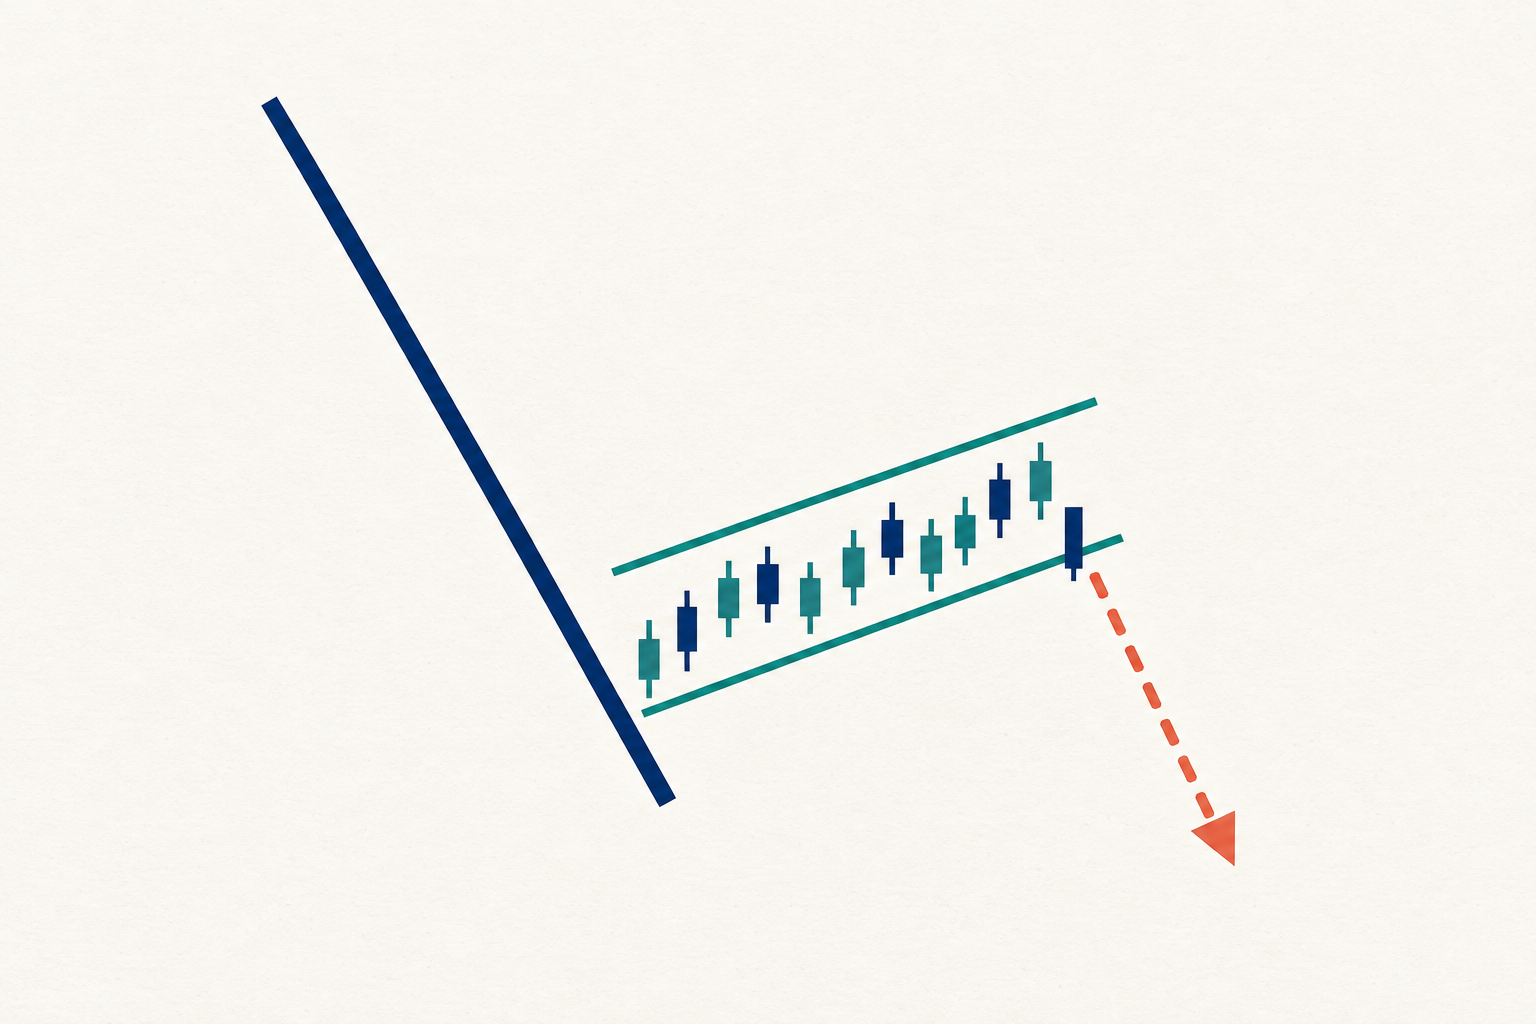
A bearish flag is a chart pattern where a sharp price drop is followed by a short, slightly upward drift, which traders read as a pause before the decline may continue. This guide covers how to spot the pole, the flag and the breakdown. It also compares the bear flag with the bear pennant and similar patterns and explains why the setup fails more often than many trading pages admit.
NEW RULERelated consumer alert, Oct 21
OCC final rule keeps issuer yield ban, reviews stablecoin rewards case by caseRun the numbers
Before you trade a pattern
A bear flag describes what the market might do, not what it will do, and many flags fail. Crypto can lose all of its value, it is not FDIC or SIPC insured, and leveraged short positions can be wiped out in minutes.
What is a bearish flag?
A bearish flag is a continuation pattern. It suggests that a downtrend paused briefly and may resume in the same direction.
The pattern has two visual pieces. The first is a steep, fast drop called the flagpole. The second is a small rectangle of price action that drifts sideways or slightly upward, called the flag. Drawn on a chart, it looks like a flag hanging upside down from a pole.
Traders treat it as a sign that sellers still control the market. The upward drift is read as a weak bounce, with short sellers taking profits and bargain hunters stepping in, rather than a real reversal. If price then breaks below the bottom of the flag, many traders take that as confirmation that the downtrend has restarted.
The bear flag is the mirror image of the more widely discussed bull flag. It shows up on every timeframe and in every market, from one-minute bitcoin charts to monthly stock charts. Crypto traders watch it closely because crypto moves fast and often, which produces plenty of poles and plenty of flags.
The three parts of a bear flag
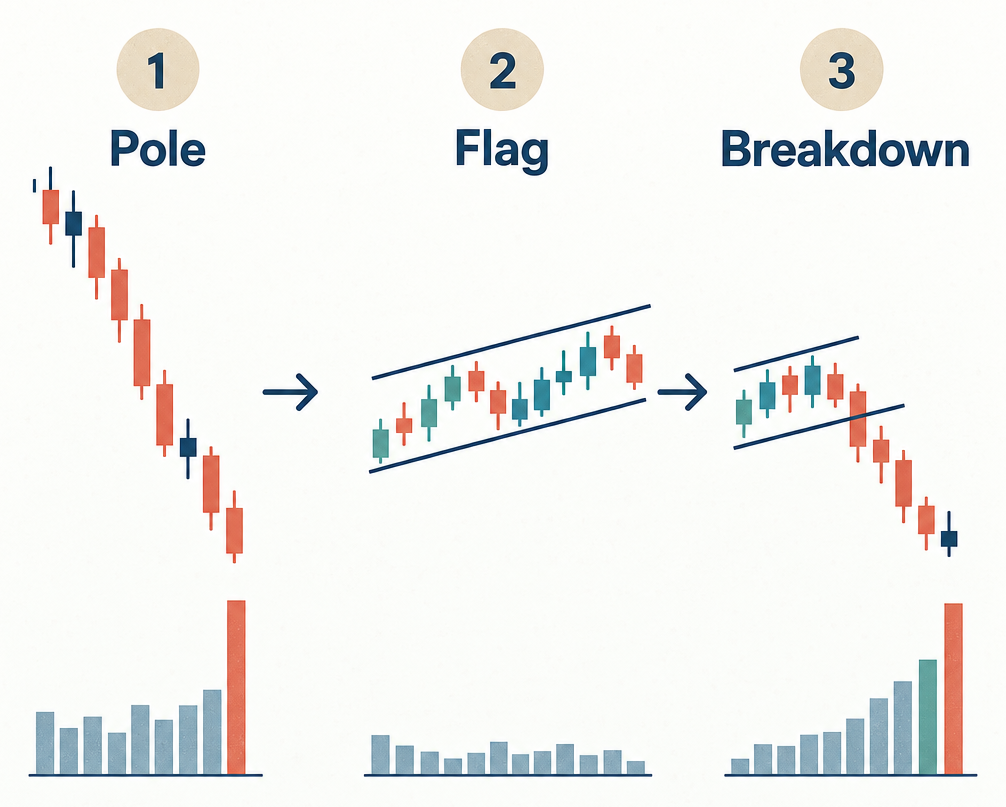
Each of the three parts has to look right before most technical analysts will call it a bear flag. Getting any one of them wrong is the most common way new traders mislabel a chart.
1. The flagpole: a sharp, high-volume drop
The pole is a fast, near-vertical decline. It usually comes on heavier-than-normal trading volume, which signals that many participants sold at once.
What counts as “sharp” depends on the asset and the timeframe. A 3% drop in an hour is dramatic for bitcoin on a quiet day. For a small-cap token, it barely registers. The test is relative: the pole should stand out clearly against the price action that came before it.
A slow, grinding decline over weeks is not a flagpole. Without a pole, there is no flag, only a downtrend with some noise in it.
2. The flag: a short, orderly consolidation
After the drop, price stops falling and starts moving inside a narrow channel. You can draw two roughly parallel trendlines: an upper trendline connecting the highs and a lower trendline connecting the lows.
In a classic bear flag, that channel tilts slightly upward, against the direction of the pole. A flat channel also qualifies for most analysts. A channel that tilts sharply downward is usually read as something else.
Three conventions help traders judge the flag:
- Shallow retracement. The bounce typically recovers only a fraction of the pole. Many traders look for less than half, and some prefer a bounce that stalls near the 38.2% Fibonacci retracement level. A bounce that recovers most of the pole weakens the bearish case.
- Short duration. The flag should be brief compared with the pole. A common rule of thumb is that a flag lasting much longer than about three weeks on a daily chart has turned into a different pattern, often a wider range or a rectangle.
- Fading volume. Volume usually dries up as the flag forms. Quiet buying during the bounce suggests buyers lack conviction.
3. The breakdown: price exits through the bottom
The pattern completes when price falls through the lower trendline of the flag. Traders call this the breakdown, or a downward breakout.
Most cautious traders wait for a candle to close below the lower trendline rather than reacting to a brief dip intraday. Crypto charts are full of long wicks that pierce a trendline for a few minutes and snap back. A close on the timeframe you are watching filters out some of that noise.
A rise in volume on the breakdown is the second piece of confirmation. Heavy volume on the break suggests fresh selling, not a random wobble.
How to read volume and confirmation
Volume is the closest thing a bear flag has to a lie detector. The textbook volume profile looks like this:
- Volume spikes during the pole.
- Volume tapers during the flag.
- Volume rises again on the breakdown.
When the profile breaks that script, traders lower their confidence. Rising volume during the upward drift of the flag is a warning sign. It suggests real buying interest, and real buying is how bear flags fail.
There is a catch specific to crypto. Volume is fragmented across many exchanges, and the volume bar on your chart usually reflects only one venue or one data feed. A breakdown that looks heavy on one exchange may look ordinary across the wider market. Some exchanges have also faced accusations of inflating reported volume through wash trading, which makes single-venue volume a weaker signal than it is for a US-listed stock.
Confirmation is also a trade-off. If you wait for a close below the trendline plus a volume spike, you get a cleaner signal but a worse price, because some of the move has already happened. If you act earlier, you get a better price and more false signals. No setting removes that tension.
Measuring the move: a worked example
Traders use the flagpole to set a rough price target, a technique called the measured move. You take the height of the pole and project it downward from the breakdown point.
Here is a hypothetical example using round numbers. It is an illustration, not a forecast for any real coin.
| Step | Price | What it means |
|---|---|---|
| Start of the pole | $100 | Price before the sharp drop |
| Bottom of the pole | $80 | Pole height is $20 |
| Top of the flag | $86 | Bounce recovered $6, or 30% of the pole |
| Breakdown point | $83 | Candle closes below the lower trendline |
| Measured-move target | $63 | $83 minus the $20 pole height |
| Common stop level | $87.50 | Just above the flag’s high |
The math in plain words: the pole fell $20, so the measured move subtracts $20 from the $83 breakdown, giving $63. The distance from entry to stop is $4.50. The distance from entry to target is $20. That is a reward-to-risk ratio of about 4.4 to 1, if the target is hit.
That “if” carries the whole idea. The measured move is a convention, not a law of markets. Price can stall halfway, bounce off an old support level, or reverse straight through your stop. Treat the target as one possible outcome, not an expected one.
Bear flag vs bear pennant vs other bearish patterns
Several chart patterns look like a bear flag at first glance. Here is how they compare side by side.
| Pattern | Shape of the consolidation | Usual context | Volume during pattern | How it confirms | Main weakness |
|---|---|---|---|---|---|
| Bear flag | Parallel channel, flat or tilted up | After a sharp drop | Falling | Close below lower trendline | Upward drift can turn into a reversal |
| Bear pennant | Small triangle, converging lines | After a sharp drop | Falling | Close below lower line of triangle | Breaks can go either way near the apex |
| Descending triangle | Flat support, falling highs | Within a downtrend or at a top | Usually falling | Close below flat support | Often takes longer to form, more false breaks |
| Rising wedge | Both lines rising, converging | After a decline or late in an uptrend | Falling | Close below lower line | Easy to confuse with a healthy uptrend |
| Bull flag (mirror) | Parallel channel, flat or tilted down | After a sharp rise | Falling | Close above upper trendline | Read upside down, it’s a bear flag mistake |
Bear flag
The bear flag is the most recognizable continuation pattern in a downtrend. Its parallel trendlines make it easy to draw and easy to set a stop against.
Strengths
– Clear structure: the pole, channel and breakdown are simple to identify.
– Built-in risk level: the flag’s high gives an obvious place to define your loss.
– Works on any timeframe, which suits short-term crypto charts.
Weaknesses
– The upward drift is exactly what an early reversal looks like.
– Analysts often disagree about whether a given channel is a “flag” at all.
– Measured-move targets are frequently missed, especially in thin markets.
Bear pennant
A bear pennant has the same pole as a bear flag, but the consolidation forms a small symmetrical triangle instead of a channel. The upper line slopes down and the lower line slopes up, and the two converge toward a point called the apex.
Traders read the bear pennant the same way: a pause, then a possible continuation lower. The pennant shows volatility compressing, with each swing smaller than the last.
Strengths
– Shows the market tightening, which can lead to a sharp move once price breaks.
– The narrowing range gives a tight stop if price breaks lower.
– Same measured-move logic as the flag.
Weaknesses
– Breaks near the apex are notoriously unreliable and can go up or down.
– Small pennants on short timeframes are hard to separate from random noise.
– The tighter range means a single wick can trigger a false signal.
Descending triangle
A descending triangle has a flat lower boundary (support) and a series of lower highs pressing down on it. It does not need a sharp pole first, which is the key difference from a flag or pennant.
Strengths
– Repeated tests of the same support level make the key price very visible.
– Often reflects steady selling pressure rather than one panic burst.
Weaknesses
– Takes longer to form, so it ties up attention and capital.
– Flat support levels attract many traders’ stop orders, which can produce sharp fake breakdowns.
– Not strictly a continuation pattern, so context matters more.
Rising wedge
A rising wedge slopes upward, with both trendlines rising but converging. When it appears after a decline, many analysts read it as a weakening bounce that may roll over.
Strengths
– Captures the idea of a rally losing momentum, with each push higher shorter than the last.
– Can signal trouble early, before a clean breakdown.
Weaknesses
– Looks very similar to a healthy uptrend channel.
– Subjective: two people drawing the same wedge often place the lines differently.
Bull flag: the mirror image
A bull flag is the same structure flipped: a sharp rise, a small downward or flat consolidation, then a break above the upper trendline. It belongs in this comparison because traders frequently confuse the two when a chart is choppy.
Strengths
– Useful as a check: if what you thought was a bear flag breaks upward strongly, the market may be telling you the trend is up.
Weaknesses
– In a volatile market, short flags in both directions appear constantly, so either label can be wrong.
Which pattern reading should you trust?
No pattern in this table is “best.” Each one is a way of describing crowd behavior, and each fails regularly. A few guidelines help you weigh them:
- Trust context over shape. A bear flag inside a clear, longer-term downtrend carries more weight than one that appears after a single bad candle in an uptrend.
- Favor the pattern with the clearest risk level. Flags and pennants give you a nearby price where you’re wrong. Patterns without one invite you to hold losing positions.
- Prefer the clean bear flag over the pennant near its apex. Late pennant breaks are the least reliable signals in this group.
- When two traders can’t agree on the label, step back. Ambiguous charts produce ambiguous outcomes.
Research supports some humility here. A widely cited 2000 study in The Journal of Finance by Andrew Lo, Harry Mamaysky and Jiang Wang found that some chart patterns in US stocks carried a measure of statistical information. That is not the same as reliable profits after costs, and crypto markets have far less long-run data behind them.
Indicators traders pair with a bear flag
Most traders don’t act on the pattern alone. They look for other indicators that agree with it. None of these is a confirmation on its own, and all of them lag price to some degree.
Moving averages
A bear flag that forms below a falling 50-day or 200-day moving average fits a broader downtrend. A flag whose bounce stalls right at a moving average is read by some traders as that line acting as resistance.
Relative Strength Index (RSI)
The RSI measures momentum on a 0 to 100 scale, usually over 14 periods. In a bear flag, traders often look for RSI to stay below 50 during the bounce. A bounce that pushes RSI well above 50 suggests stronger buying than the pattern implies.
MACD
The Moving Average Convergence Divergence indicator compares two moving averages. Some traders want the MACD line to stay below its signal line during the flag, or to cross back below it near the breakdown.
Volume tools
Beyond the raw volume bars, some traders use On-Balance Volume, which adds volume on up periods and subtracts it on down periods. If On-Balance Volume keeps falling while price drifts up in the flag, it supports the bearish read.
Support and resistance levels
Old price levels matter. If the measured-move target sits right below a level where buyers stepped in heavily before, many traders expect the drop to stall there instead.
A word of caution on stacking indicators: adding more of them doesn’t make a signal more accurate if they all measure the same thing. RSI, MACD and moving averages are all built from price, so three “confirmations” can amount to one opinion repeated three times.
Why bear flags fail, especially in crypto
A failed bear flag happens when price breaks out of the top of the flag instead of the bottom, or breaks down briefly and then reverses sharply. Traders call the second case a bear trap.
Crypto has several features that make failures more common:
- It trades 24/7. Weekend and overnight sessions often have thin liquidity, so a modest order can push price through a trendline and back.
- Liquidation cascades. On derivatives exchanges, a quick move up can force short sellers’ positions to close automatically. Those forced buys push price higher, which liquidates more shorts. A tidy bear flag can turn into a violent rally in minutes.
- News shocks. Regulatory announcements, ETF decisions, exchange failures and hacks can overpower any chart pattern instantly.
- Large holders. A handful of big wallets can move smaller tokens, and their trades don’t respect trendlines.
- Crowded setups. When a bear flag is obvious, many traders place stops just above the flag. A spike that clears those stops can feed on itself.
A bear flag is a picture of orderly selling. Capitulation is the opposite, and the capitulation definition most analysts use centers on panic selling on extreme volume. A sequence of bear flags sometimes ends in capitulation, but the pattern itself tells you nothing about when or whether that happens.
Timeframe matters too. A trader running a scalping trading strategy might spot a dozen bear flags on one-minute charts in a single day. Signals that small are mostly noise, and trading costs eat a larger share of each tiny move.
What bear flag trading looks like for a US trader
Spotting a pattern is one thing. Acting on it is where the money, the rules and the risks come in. If you own crypto, a bear flag might prompt you to reconsider your risk. If you don’t, it might tempt you to bet on a decline. These are very different situations, and US law limits how retail traders can bet on falling crypto prices.
Here are the main approaches, compared neutrally.
| Approach | What it involves | Main costs | Biggest risk | Who it can fit |
|---|---|---|---|---|
| Do nothing | Hold your position through the pattern | None | Price falls further | Long-term holders who don’t trade charts |
| Sell spot holdings | Sell some or all crypto for dollars or a stablecoin | Trading fees, spread, taxes | Selling before a rebound; triggering a taxable gain | Holders who want less exposure |
| Regulated futures | Short a futures contract on a CFTC-regulated US exchange | Commissions, margin, roll costs | Losses beyond your margin in fast moves | Experienced traders with a futures account |
| Inverse crypto ETF | Buy a fund designed to rise when its benchmark falls | Expense ratio, tracking error | Daily reset makes long holds drift from expectations | Brokerage customers seeking short exposure without margin |
| Offshore leverage | Short with high leverage on an unregistered foreign exchange | Fees, funding rates | Frozen funds, no US protections, possible legal exposure | Not appropriate for US residents |
Doing nothing
Pros: No fees, no tax event, no chance of selling at the bottom. For someone storing coins in a cold wallet as a multi-year holding, short-term chart patterns are mostly irrelevant.
Cons: You absorb the full decline if the pattern plays out.
Selling spot holdings
Pros: Simple and widely available. No leverage, so you can’t lose more than you hold.
Cons: Every sale is a taxable disposal under IRS rules, even if you sell into a stablecoin rather than dollars. If the flag fails, you may buy back higher. Fees and spreads add up, and if you originally bought through a crypto ATM, those markups mean a quick round trip has to clear a lot of cost before it breaks even.
Regulated futures
Bitcoin and ether futures trade on CFTC-regulated exchanges such as CME Group. They let you profit if price falls.
Pros: Regulated venue, clear contract terms, and oversight by the Commodity Futures Trading Commission. Customer funds at registered futures commission merchants are subject to segregation rules.
Cons: Margin requirements are substantial, and losses can exceed the money in your account. Futures roll and expire, which adds complexity. Fast crypto moves can trigger margin calls before you can react.
Inverse crypto ETFs
Some US-listed funds aim to deliver the opposite of a crypto benchmark’s daily return, typically by holding futures.
Pros: Available in an ordinary brokerage account, with no margin needed and losses limited to what you invest.
Cons: Most reset daily, so over several days the fund’s return can differ a lot from the inverse of the coin’s return, especially in choppy markets. Expense ratios are higher than plain index funds. Read the prospectus before assuming how one behaves.
Offshore leverage
Pros: None that outweigh the risks for a US resident.
Cons: Many offshore exchanges aren’t registered with US regulators and say in their terms that they don’t serve US customers. The CFTC sued Binance in 2023 for offering crypto derivatives to US customers without registering, and earlier brought action against BitMEX. If an unregistered venue freezes withdrawals or collapses, you have little recourse.
A worked cost example for a leveraged short
Using the hypothetical chart above, suppose you short $1,000 worth of exposure at the $83 breakdown, using $200 of your own money as margin. That is 5x leverage. Assume round-trip fees of about $2, which is a hypothetical figure; actual fees vary by platform and account.
| Scenario | Exit price | Price move vs. entry | Gross result | After ~$2 fees | Result as % of $200 margin |
|---|---|---|---|---|---|
| Target hit | $63 | Down 24.1% | +$241 | +$239 | +119% |
| Stopped out as planned | $87.50 | Up 5.4% | -$54 | -$56 | -28% |
| Weekend spike gaps past stop to $92 | $92 | Up 10.8% | -$108 | -$110 | -55% |
| Squeeze to $99.60 | $99.60 | Up 20.0% | -$200 | Margin gone | -100% or more |
The math in plain words: a short position gains when price falls and loses when it rises. At 5x leverage, every 1% move in the coin is a 5% swing in your $200. A 20% rally against you erases the entire margin. In practice, most platforms liquidate you before that point because of maintenance margin requirements, and a stop order doesn’t guarantee your exit price if the market jumps past it.
Lower-risk ways to learn chart patterns
Practice on a paper-trading account before risking money.
Learn on spot charts without leverage, where losses are capped at what you hold.
Never fund trades with a payday loan, an installment loan or a credit card cash advance.
If you’re looking at bear flag trading as a way to make money fast, the table above is the reality check. Pattern trading is a slow skill with frequent losses, and borrowed money turns ordinary losses into debt.
Why the CFD and binary options ads aren’t for you
Many of the pages that rank for “bearish flag” belong to overseas brokers selling contracts for difference (CFDs) on crypto, bonus programs and binary options. Those pages exist to send you to an account signup. For a US reader, most of what they offer isn’t legally available.
CFDs. A contract for difference lets you bet on a price move without owning the asset. CFDs aren’t offered to ordinary US retail customers; US rules restrict these over-the-counter contracts to eligible contract participants, a category defined by large asset thresholds. A broker that offers you crypto CFDs from abroad is almost certainly operating outside US registration.
Binary options. These pay a fixed amount if a condition is met, such as price finishing below a level by a set time. The CFTC and SEC have warned for years that many online binary options sites are unregistered and some are outright fraud. In the US, binary options can legally trade only on CFTC-registered exchanges.
Bonus programs. Deposit bonuses often come with trading-volume conditions that lock up your money until you have traded many times your deposit. That structure rewards the platform, not you.
If a pattern tutorial ends with a push to open an account, treat the tutorial as advertising.
Taxes: how the IRS treats trades around a bear flag
Under IRS Notice 2014-21, the IRS treats virtual currency as property, not currency. That rule shapes every trade you make in response to a chart pattern.
Selling or swapping is a taxable event. Selling crypto for dollars, swapping one coin for another, or moving into a stablecoin all count as dispositions. You calculate a capital gain or loss by comparing what you received with your cost basis.
Holding period sets the rate. Crypto held one year or less produces short-term gains, taxed at your ordinary income rates. Crypto held longer than a year produces long-term gains, taxed at 0%, 15% or 20% depending on your income. Pattern trading almost always produces short-term gains.
Losses can offset gains. Capital losses offset capital gains. If losses exceed gains, you can deduct up to $3,000 a year against ordinary income ($1,500 if married filing separately) and carry the rest forward to future years.
The wash sale rule. Internal Revenue Code Section 1091 disallows losses when you sell a security at a loss and buy substantially identical securities within 30 days before or after the sale. Because the IRS treats crypto as property rather than a security, that rule has not applied to spot crypto under current law. Proposals to extend it to digital assets have been introduced in Congress but have not become law as of this writing. Check the current rule before you rely on it.
Futures are taxed differently. Regulated futures contracts traded on US exchanges are generally treated as Section 1256 contracts. Gains and losses are split 60% long-term and 40% short-term regardless of how long you held them, marked to market at year end, and reported on Form 6781. Confirm the treatment of any specific product with a tax professional.
Reporting. You report crypto sales on Form 8949 and Schedule D, and Form 1040 asks directly whether you disposed of a digital asset during the year. Under Treasury’s broker reporting rules, US crypto brokers must report gross proceeds on the new Form 1099-DA for sales starting January 1, 2025, with cost basis reporting for many sales starting in 2026.
Active trading creates many small tax lots. Keep records of every trade’s date, amount, price and fees from the start.
Checking a platform and spotting scams
Chart pattern content attracts scammers. Fake “signal groups” on Telegram and Discord post bear flag screenshots, promise accuracy rates, then steer followers to unregistered platforms or pump-and-dump tokens. The FBI’s Internet Crime Complaint Center reported about $9.3 billion in losses tied to cryptocurrency in its 2024 report, with investment fraud making up a large share.
Red flags to watch for:
- Promises of a fixed win rate or “guaranteed” returns from pattern signals.
- Pressure to move to a private chat or a platform you haven’t heard of.
- Profits you can see on a dashboard but can’t withdraw, or withdrawal “taxes” or fees demanded upfront.
- Someone you met online, often through a dating app or a wrong-number text, who offers to teach you trading.
- Paid “VIP” signal tiers sold by anonymous accounts.
How to check a crypto platform before using it
- Search the company in NMLS Consumer Access to see which states license it for money transmission.
- Confirm federal registration as a money services business through FinCEN’s MSB search.
- For futures or derivatives, check the firm in the National Futures Association’s BASIC database.
- For brokers selling securities or ETFs, look the firm up on FINRA BrokerCheck or the SEC’s adviser search.
- Check your state financial regulator’s license lookup; some states, like New York, require their own crypto license.
If something goes wrong, report it. File a complaint with the CFPB through its online complaint portal, report fraud to the FTC at ReportFraud, and report internet-based crypto fraud to the FBI’s IC3. Derivatives fraud can also go to the CFTC, and securities fraud to the SEC.
Who chart patterns can make sense for
Learning to read a bearish flag can help you understand what other traders are watching and why a market behaves the way it does around certain levels. That has value even if you never place a trade on it.
Pattern-based trading is a closer fit for people who:
- Can afford to lose the money they trade, without touching rent, emergency savings or borrowed funds.
- Use spot positions or small, defined-risk trades, and decide their exit before they enter.
- Keep records and review losing trades honestly.
- Accept that a meaningful share of setups will fail.
It is a poor fit if you’re under financial pressure, hoping to recover losses quickly, or tempted by leverage. Chart patterns don’t change the odds enough to rescue a tight budget, and the volatility of crypto can make a bad month much worse.
FAQ
What is a bearish flag?
A bearish flag is a chart pattern made of a sharp price drop (the flagpole) followed by a short, narrow consolidation that drifts flat or slightly upward (the flag). Traders read it as a pause in a downtrend. The pattern is considered complete when price closes below the flag’s lower trendline, ideally on rising volume.
What does a bear flag mean?
A bear flag means sellers appear to still be in control after a sharp drop. The weak bounce suggests buyers aren’t committed. Traders interpret it as a possible sign the downtrend will continue, but it is a probability read on crowd behavior, not a prediction, and it fails often.
Can a bear flag be bullish?
A bear flag is bearish by definition, but it can fail in a bullish way. If price breaks above the upper trendline on strong volume instead of breaking down, the bearish setup is invalidated. Short sellers may then rush to close positions, which can push price higher still. Traders treat a failed bear flag as useful information that the downtrend may be weaker than it looked.
Is XRP forming a bull flag?
US Financer doesn’t make calls on individual coins. You can check any chart yourself with the same tests in this guide: look for a sharp rise on heavy volume (the pole), a short flat or downward-sloping channel on fading volume (the flag), and a close above the upper trendline on rising volume. Even a textbook bull flag on XRP or any other coin can fail, and XRP, like all crypto, can lose value quickly.
What is the difference between a bear flag and a bear pennant?
Both follow a sharp drop and both point to possible continuation lower. In a bear flag, the consolidation sits between two roughly parallel trendlines. In a bear pennant, the consolidation forms a small triangle, with the lines converging toward a point. Pennant breaks near the apex are generally less reliable.
How long does a bear flag last?
There’s no fixed length. The flag should be short compared with the pole. On daily charts, a common rule of thumb is that a flag lasting much longer than about three weeks has turned into a different pattern. On intraday crypto charts, a flag can form and resolve within minutes or hours.
Is crypto I trade on a bear flag protected if a platform fails?
No. Crypto is not covered by FDIC deposit insurance or SIPC protection, even when held at a company that also offers insured bank or brokerage accounts. If a crypto platform collapses or is hacked, you may lose some or all of your holdings.
Laws and regulations referenced
- IRS Notice 2014-21 (virtual currency is property)
- IRS Form 1099-DA, Digital Asset Proceeds From Broker Transactions
- IRS Form 8949, Sales and Other Dispositions of Capital Assets
- IRS Schedule D (Form 1040), Capital Gains and Losses
- Wash sale rule, 26 U.S.C. 1091
Links go to the official text on government sites.
Check, verify or complain
Sources
- thetaxadviser.com › issues › 2026 › mar › navigating the form 1099 da reporting maze thetaxadviser.com
- cpavalidated.com › section 1256 contracts mark to market cpavalidated.com
- coinledger.io › blog › cryptocurrency tax rates coinledger.io
- coindesk.com › markets › 2025 › 04 › 24 › fbi says americans lost usd9 3b to crypto scams in… coindesk.com

Owen explains how crypto works for US readers: coins and tokens, buying and selling, wallets and self-custody, staking and DeFi. He sticks to how things work and what they cost, never price calls, and checks platform fees and licensing against the companies' own disclosures.

Ruth is US Financer's standards editor. Every article goes through her checks before and after it is published: each rate, fee, cap, deadline and rule is matched against its primary source, every law named is linked to its official text, and anything that cannot be…
Comments are closed