


Crypto can lose all of its value and is not protected by FDIC or SIPC insurance. This is education, not investment advice.
Bitcoin fell about 54% from its October 2025 record to its July 2026 low. Then it bounced, and traders started arguing about whether the next dip was “a higher low.” The term has a precise meaning, and several widely read glossaries get it wrong. This guide covers the correct definition, a step-by-step way to confirm a higher low, what it does and does not tell you, and the risk math to do before you trade one.
SCAM ALERTRelated consumer alert, Nov 13, 2026
FBI warns crypto users of fake Zoom and Teams calls from hijacked contactsKey takeaways
- A higher low is a swing low (a trough with higher bars on both sides) that sits above the previous swing low. A close above yesterday’s close does not count.
- A higher low only becomes useful once price goes on to make a higher high. That means confirmation always arrives late.
- A daily close below the most recent higher low breaks the structure. A wick that dips below and closes back above is only a test.
- Size every trade from the stop: account size × risk % ÷ (entry − stop) gives the number of units.
- FINRA’s amended day-trading margin requirements, which replace the $25,000 pattern day trader minimum, took effect June 4, 2026, with a transition period for firms running through October 20, 2027. That makes frequent trading easier to start, but it does not make it more profitable.
Fact-checked
We checked these key facts against the sources named, on November 13, 2026:
- Of the 1,551 who kept going for more than 300 days, 97% lost money (source: papers.ssrn.com)
- The change removes the “pattern day trader” label and the $25,000 minimum equity (source: acaglobal.com)
- They followed all 19,646 people who started day trading mini-Ibovespa futures from 2013 to 2015 (source: papers.ssrn.com)
- The $2,000 minimum equity for margin accounts still applies, and brokers can set higher minimums (source: jdsupra.com)
- A higher low is bullish only in context, and only after a higher high follows it (source: coinmarketcap.com)
What is a higher low? (The 30-second answer)
A higher low is a swing low that bottoms out above the previous swing low on the same chart and timeframe. When higher lows alternate with higher highs, the market is in an uptrend. That is the core idea of market structure.
Higher low in plain English
Price never moves in a straight line. It rises, pulls back, rises again. Each pullback leaves a trough, and the trough is the swing low. If the newest trough is above the one before it, buyers stepped in sooner than last time. That earlier buying is what the label describes.
Price
  |                         HH
  |            H            /\
  |           /\           /  \
  |          /  \         /    \
  |         /    \       /
  |        /      \     /
  |       /        \   /
  |      /          \_/
  |     /           HL
  |    /
  |  _/
  |  L
  +--------------------------------- Time
   L = earlier swing low   HL = higher low
   H = swing high          HH = higher high
The idea goes back to Charles Dow, whose Wall Street Journal writing around 1900 to 1902 described trends as rising peaks and troughs. Robert Rhea codified it in The Dow Theory (1932). Edwards and Magee applied the higher-highs-and-higher-lows rule to individual stock charts in their 1948 book.
What a higher low is not
Some crypto glossaries define a higher low as a daily close above the previous day’s close. Others call it any moment when the current price is above the previous low. Both definitions are wrong, and the reason matters.
On a close-to-close definition, almost every up day counts as a “higher low.” During Bitcoin’s slide from about $126,000 to under $60,000, there were plenty of up days, yet the market kept making lower lows. A definition that flags bullish structure all through a 54% decline is worse than no definition at all. A real higher low compares two swing lows, not two bars and not price against a level.
Higher low vs lower high vs higher high vs lower low
There are four swing labels: two for peaks and two for troughs. What matters is how they combine. A higher low paired with a higher high is an uptrend. A lower high paired with a lower low is a downtrend. The other two pairings describe ranges and choppy markets.
The four combinations
| Label | Definition | Combination | What it suggests | Typical trader bias |
|---|---|---|---|---|
| Higher high (HH) | Swing high above the prior swing high | HH + HL | Uptrend | Look for long entries on pullbacks |
| Higher low (HL) | Swing low above the prior swing low | HL + LH | Coil (contracting range) | Wait for a breakout either way |
| Lower high (LH) | Swing high below the prior swing high | LH + LL | Downtrend | Avoid longs; some look for shorts |
| Lower low (LL) | Swing low below the prior swing low | LL + HH | Expanding range (whipsaw) | Reduce size or stand aside |
Is it “higher low” or “lower high”? Both terms exist, and they describe different points. A higher low is a trough. A lower high is a peak. The opposite of a higher low is a lower low. In a downtrend, the lower high plays the role a higher low plays in an uptrend.
When a higher low and a lower high show up together
If price makes a higher low and then a lower high, the trend is not over yet. It has stalled. Buyers are defending higher prices, and sellers are capping lower prices, so the swings squeeze into a triangle or coil. Trend rules give you nothing here. The useful signal is which side of the coil price closes outside of. Continuation patterns such as a bear flag form inside the same kind of mixed structure.
How to spot a higher low on a chart, step by step
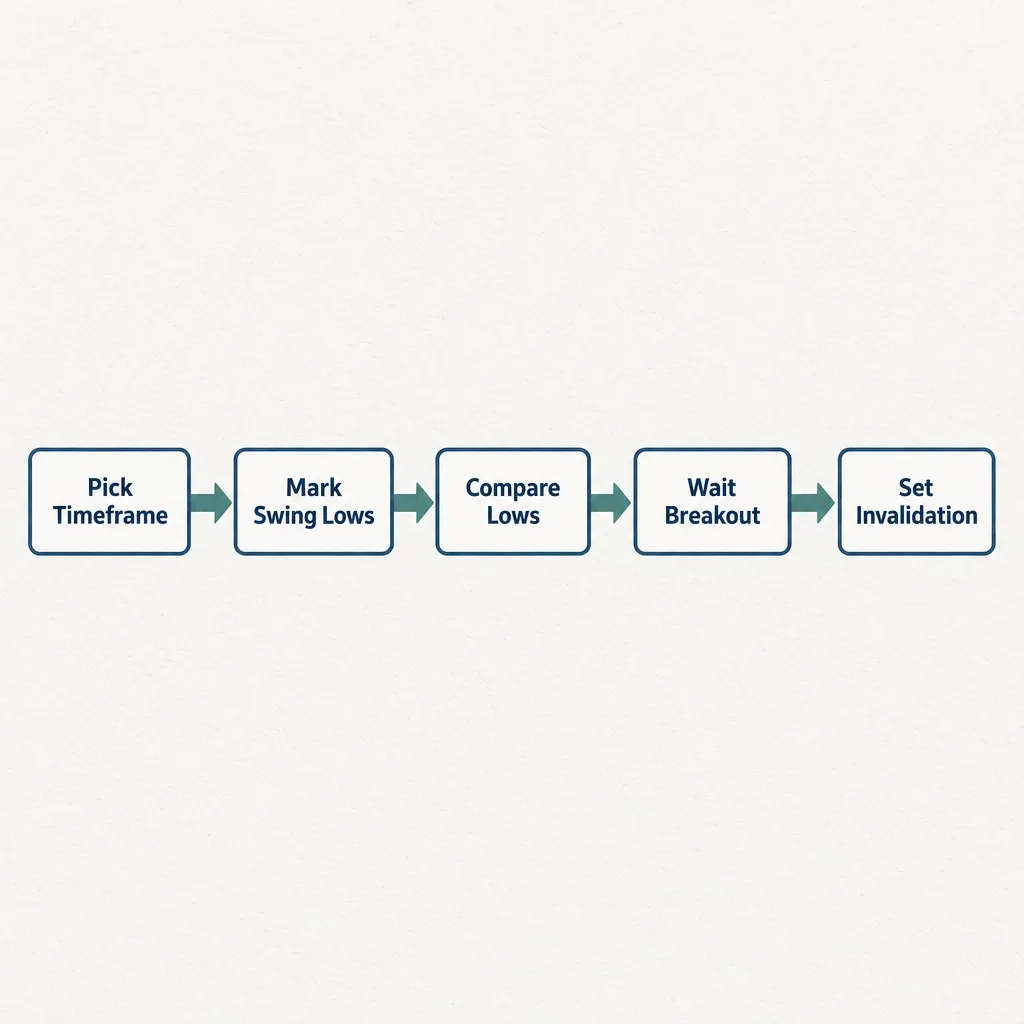
To find a higher low reliably, use a fixed rule for what counts as a swing low, compare lows from left to right, and wait for price to take out the previous swing high before you call it confirmed. Without a fixed rule, you end up labeling every wiggle.
How to confirm a higher low
- Pick one timeframe, ideally daily or weekly, and stay on it.
- Mark swing lows from left to right using a fixed pivot rule, such as 5 bars on each side.
- Compare each new swing low to the one before it.
- Treat a higher one as a candidate until price closes above the prior swing high.
- Mark your invalidation: a body close below that higher low.
Step 1: Find the swing lows
A swing low, or pivot low, is a bar whose low is lower than a set number of bars on both sides. That number is your pivot setting, and it decides which lows count.
The common complaint “I keep marking every little dip and my chart is a mess” is a pivot-setting problem. There is no universal number of candles that makes a real swing. You pick one and apply it the same way every time.
| Pivot setting | Strengths | Weaknesses | Best for |
|---|---|---|---|
| 2 bars each side | Catches turns early; confirms 2 bars later | Marks minor noise as swings; many false higher lows | Very short-term charts, scalping |
| 5 bars each side | Balances noise and delay | Still misses some fast turns | Most daily and 4-hour swing analysis |
| 10 bars each side | Only marks major lows; few false signals | Confirms 10 bars late; on a daily chart that is about two weeks | Weekly trend direction, position trading |
| Manual (by eye) | Flexible; can use context | Inconsistent; easy to see what you want to see | Learning, once you have a fixed rule to check against |
Which should you choose? Start with 5 bars on the daily chart. A 2-bar rule produces too many signals for most readers, and on short charts it pulls you toward scalping, which has its own steep risks. A 10-bar rule is cleaner, but its delay suits slower decisions. Whatever you pick, apply it the same way everywhere.
Mark the swing low at the wick, which is the true extreme. That is where your stop logic lives. Judge breaks and confirmations on body closes, which comes up again below.
Step 2: Compare each to the one before
Work left to right. Label each swing low HL or LL compared with the previous swing low, and each swing high HH or LH compared with the previous swing high. Do this on one timeframe only. Comparing a daily low with a 15-minute low gives you a meaningless label.
Step 3: Wait for confirmation
A low becomes a confirmed higher low when price rallies away from it and closes above the previous swing high. That close completes the higher high and finishes the pattern. Before then, the low is only a candidate. The market may still drop through it.
| Situation | What price did | Status | What it means |
|---|---|---|---|
| Pivot formed, no new high | Bounced above prior low, still below prior high | Not confirmed (candidate) | Possible higher low; could be a pause before more selling |
| Close above prior swing high | Rallied and closed through the last peak | Confirmed | Uptrend structure intact: HL + HH |
| Wick below, close above | Spiked under the higher low, closed back above it | Tested, still valid | Buyers defended the level |
| Close below the higher low | Body closed under the swing low | Broken | Uptrend structure invalidated (break of structure) |
Candidate first, label second
Don’t call a low a higher low until price has rallied away from it and closed above the previous swing high. Until then it’s a candidate.
Why confirmation always arrives late
You can only know a low is a higher low after price has already moved away from it. Dow Theory-style signals are late by design, because they need a completed swing.
Here is the cost in numbers. Say the candidate low is at $100 and the prior swing high is at $110. Confirmation needs a close above $110. By then, roughly 10% of the move off the low is already behind you.
Traders who want to enter earlier have two main options:
- Enter on the pivot, not the breakout. Once the pivot rule is met (say, five higher bars after the low), some enter with a smaller position. The trade-off is that more of these entries fail.
- Drop one timeframe for the trigger. Keep the daily structure as the context. Then enter when the 1-hour chart makes its own higher low and higher high. You get an earlier, tighter entry, but lower-timeframe signals fail more often.
Neither option removes the fake-outs. They trade a later, more reliable signal for an earlier, less reliable one.
Is a higher low bullish?
A higher low is bullish only in context, and only after a higher high follows it. On its own, it shows that sellers ran out of steam sooner than last time. It does not show that buyers have taken control.
In an uptrend
Inside an established run of HH and HL, a new higher low is a continuation signal. The trend is doing what trends do. Price pulls back, holds above the last trough, and resumes. This is the setup most traders mean when they talk about buying the higher low.
After a downtrend
The first higher low after a series of lower lows is a possible reversal, not a trend. For the downtrend to end in structure terms, price must also close above the last lower high. One higher low after a long decline often turns into a range rather than a new uptrend.
When it means nothing: choppy, range-bound markets
In a sideways market, lows bounce between roughly the same levels. A low that happens to be $3 higher than the last one tells you nothing. If swing highs and lows keep crossing each other, trend labels are the wrong tool for that chart.
When a higher low fails: break of structure
A higher low fails when a candle body closes below it. Traders call this a break of structure (BOS). It means the sequence of rising troughs that defined the uptrend has been cut.
Wick vs body close
A wick that pierces the higher low and closes back above it is a test. Stops get hit and liquidity gets taken, but the structure holds. A close below is the break. Wicks are common in thin markets, and crypto often trades on low weekend volume, so judging by wicks produces many false breaks. Use closes on the timeframe you are analyzing.
Closes decide, wicks don't
A wick below the prior low that closes back above it is a test, not a break. Wait for the candle to close on your chosen timeframe before you change your read.
What traders do after a break
A break means the long idea is invalid, so a disciplined long trader exits. It does not automatically mean “go short.” The broken structure often turns into a range first. A downtrend needs its own lower high and lower low before the bearish reading carries the same weight.
Real example: Bitcoin’s 2025–2026 swings
Bitcoin’s moves from late 2025 to late 2026 show the full cycle: a peak, a run of lower lows, a rebound, and a pullback that is only a higher-low candidate. This is a reading of past data, not a forecast.
Mapping the swings
| Date | Price (approx.) | Swing type | Higher/lower than previous? |
|---|---|---|---|
| Oct 6, 2025 | About $126,000 | Swing high (all-time high) | Higher high: record |
| Feb 6, 2026 | Just over $60,000 | Swing low | Lower low: first major trough of the decline |
| Jul 1, 2026 | $58,589 (Chartrow daily data) | Swing low (cycle low) | Lower low than February |
| Early Oct 2026 | About $85,300 (Oct 6) | Rebound high | Lower high than $126,000 |
| Oct 30, 2026 | $76,892 close | Pullback low (candidate) | Higher than $58,589 |
Intraday feeds printed slightly lower around July 1 (near $57,800 to $57,950), and Bitcoin also slipped below its 200-week moving average that summer. Measured from about $126,000, the October 30 close was about 38% below the record. CryptoBriefing reported Bitcoin roughly 32% below its peak on the first anniversary of the high.
Did you know?
According to Chartrow’s drawdown data, Bitcoin fell about 54% from its October 6, 2025 record near $126,000 to a July 1, 2026 low of $58,589.
What would confirm or cancel the higher low
As of the October 30 close, the $76,892 area was a candidate, not a confirmed higher low. It sits above July’s $58,589, but the pattern is not finished. Here is what each outcome would mean under the rules above:
- Confirm: price forms a pivot low near that pullback, then posts a daily close above the early-October rebound high near $85,000. That would give HL + HH on the daily chart.
- Shift the level: price drops below $76,892 but holds above $58,589. The higher-low candidate simply moves down to the new trough.
- Cancel: a daily close below $58,589 produces another lower low, and the downtrend structure resumes.
The decline also shows why close-to-close definitions fail. Bitcoin had many up days between October 2025 and July 2026, and none of them changed the lower-low structure.
How traders use higher lows (and the risk math)
The standard use is to enter on a pullback that holds above the last confirmed higher low, put the stop just below that low, and size the position so a stop-out costs a fixed slice of the account. The stop and the sizing matter more than the pattern.
Entry and stop placement
The higher low marks where the uptrend idea is wrong. A stop a little below it, past the wick, means you exit only if the structure actually breaks. A stop placed far below “for safety” means larger losses. Moving a stop lower once the trade goes against you turns a planned loss into an open-ended one.
Position size in dollars
The formula: account size × risk % ÷ (entry − stop) = units.
The table uses round illustrative prices to show the math. Stock example: entry $50, stop $48. Bitcoin example: entry $78,000, stop $75,500.
| Account size | Risk % per trade | Dollar risk | Entry minus stop | Shares/units |
|---|---|---|---|---|
| $1,000 | 1% | $10 | $2.00 | 5 shares ($250 position) |
| $1,000 | 3% | $30 | $2.00 | 15 shares ($750 position) |
| $10,000 | 1% | $100 | $2.00 | 50 shares ($2,500 position) |
| $10,000 | 2% | $200 | $2.00 | 100 shares ($5,000 position) |
| $1,000 | 1% | $10 | $2,500 | 0.004 BTC ($312 position) |
| $10,000 | 1% | $100 | $2,500 | 0.04 BTC ($3,120 position) |
Two cautions. Fees and slippage come on top of the dollar risk. And a stop is not a guarantee: stocks can gap over a weekend, and crypto can drop through a level in seconds, so you may be filled below your stop.
Size from the stop, not the hunch
Work out the dollar risk before you enter. If $10 is what you can afford to lose and the stop is $2 away, the answer is 5 shares, however strong the setup looks.
The 3-5-7 rule
The 3-5-7 rule is a rule of thumb for limiting risk, not a regulation. The most common version says:
- 3%: risk no more than 3% of the account on any single trade.
- 5%: keep total risk across all open trades at 5% or less.
- 7%: make winners at least 7% larger than losers.
Sources disagree on the 7. Some read it as a profit target equal to 7% of the account. Others read it as a reward-to-risk target. No original author or study stands behind the numbers. Many risk guides suggest 1% to 2% per trade for small accounts or volatile assets, and 3% on a Bitcoin position is aggressive.
Higher lows across timeframes and markets
Every timeframe has its own structure. A daily uptrend can contain a 15-minute downtrend. Start with the higher timeframe, because its swings involve more trading and change less often.
Higher timeframe first
“The 1-hour chart shows an uptrend but the 5-minute shows lower highs. Which one do I trust?” Both are accurate. They describe different things. The 5-minute lower highs are probably the pullback that forms the next 1-hour higher low. Use the higher timeframe for direction and the lower one only for timing. If they conflict for long, the higher timeframe is right more often, and position size should be smaller.
Forex, stocks and crypto differences
The definition is the same in every market. What differs is when a bar closes:
- Forex (EUR/USD): trades around the clock on weekdays. Many platforms close the daily bar at 5 p.m. New York time, so daily swing lows depend on the broker’s server time.
- Stocks (S&P 500, SPY): regular sessions with overnight and weekend gaps. A gap can jump straight past a higher low, so break of structure can happen with no candle trading at your stop.
- Crypto (Bitcoin): trades 24/7 with no closing bell. The “daily close” is set by the exchange or the charting platform, often midnight UTC, so two charts can show slightly different swing lows. Thin weekend trading produces more wick tests.
Higher high/lower low indicators on TradingView
TradingView has a built-in Pivot Points High Low indicator with adjustable left and right bar counts. Its Pine Script language has ta.pivotlow and ta.pivothigh functions, and community scripts use them to label HH, HL, LH and LL automatically.
These tools are useful, but the labels depend on the settings. Change a 10-bar setting to 3 and the same chart shows different higher lows. The labels also appear only after the right-side bars have printed, so the delay you have when marking by hand is still there. Mark structure by hand first, then check the indicator against your own labels.
What to confirm a higher low with
Other tools can support a higher-low read, but none replaces the swing structure, and each has blind spots.
- Trendline: a line through two or more higher lows shows how steep the trend is. Its limit: where you draw it is subjective, and steep lines break often without the trend ending.
- Moving average: a higher low that holds near a rising 50-day or 200-day average adds context. Its limit: averages lag by construction, and they do not form higher lows themselves.
- Relative Strength Index (RSI): bullish divergence (price makes a lower low while RSI makes a higher low) often comes before the first higher low after a downtrend. Its limit: divergence can repeat several times before price turns.
- Volume: a bounce off a higher low on rising volume shows real buying. Its limit: crypto volume is spread across many exchanges, so no single chart shows all of it.
Before you trade a pattern: what the data and the rules say
Chart patterns describe price. They do not change the odds that most short-term retail traders face. Two facts matter most: how day traders actually do, and what the 2026 US rule change does and does not change.
Before you trade crypto
Crypto can lose all its value, and crypto held on an exchange is not FDIC or SIPC insured. A clean higher low does not protect you from a 54% drawdown like Bitcoin’s in 2025–2026.
How most day traders actually do
The best-known evidence comes from Brazil. Researchers Fernando Chague, Rodrigo De-Losso and Bruno Giovannetti used data from Brazil’s securities regulator, the Comissão de Valores Mobiliários. They followed all 19,646 people who started day trading mini-Ibovespa futures from 2013 to 2015. Of the 1,551 who kept going for more than 300 days, 97% lost money. The authors found no evidence that traders got better with experience.
The share of traders with any net profit fell the longer people kept trading:
| Days of day trading | Share with positive net profit |
|---|---|
| 2–50 | 13% |
| 51–100 | 9% |
| 101–200 | 6% |
| 201–300 | 4% |
| 300+ | 3.0% |
Did you know?
In the Brazilian study of day traders who persisted beyond 300 days, only 17 of 1,551 (1.1%) earned more than the Brazilian minimum wage, according to Quantpedia’s summary of the paper.
If you need money fast, short-term trading is one of the least reliable ways to get it.
The 2026 pattern day trader rule change
The pattern day trader rule is gone. The SEC approved FINRA’s amendments to FINRA Rule 4210, and FINRA Regulatory Notice 26-10 replaced the day-trading margin requirements with intraday margin standards, effective June 4, 2026. The change removes the “pattern day trader” label and the $25,000 minimum equity. Brokers have until October 20, 2027 to phase in the new approach. FINRA followed up with Regulatory Notice 26-11 on May 19, 2026, which added interpretations and investor education materials.
“The PDT rule is gone. Does that mean I can day trade a small account now?” Technically, more often than before. The $2,000 minimum equity for margin accounts still applies, and brokers can set higher minimums. The rule covered margin accounts at securities brokers, so it never applied to spot crypto exchanges anyway. Easier access means a small account can now make many more trades, and the Brazil data shows where frequent trading usually ends up.
If you trade crypto, each sale is a taxable event. Under IRS Notice 2014-21 the IRS treats crypto as property. Gains on coins held one year or less are taxed at ordinary income rates. Brokers now report sales on Form 1099-DA, so frequent trades also mean more records to reconcile at tax time.
Common mistakes
Most higher-low errors come from labeling too soon, labeling too much, or ignoring the bigger picture.
- Marking every wick. Without a fixed pivot rule, every dip looks like a swing low. Pick a bar count and stick to it.
- Calling it before confirmation. A bounce is not a higher low until price closes above the previous swing high.
- Ignoring the higher timeframe. A 15-minute higher low inside a weekly downtrend is a weak setup.
- Trading inside chop. When highs and lows overlap, trend labels mislead. Stand aside or treat it as a range.
- Moving the stop lower. If price closes below the higher low, the reason for the trade is gone. Lowering the stop only makes the loss bigger.
- Using the close-to-close definition. It flags “higher lows” all through downtrends.
FAQ
What does “higher lows” mean?
A series of swing lows where each one is above the one before. Together with higher highs, it defines an uptrend.
Is it higher low or lower high?
Both are real terms. A higher low is a trough above the prior trough. A lower high is a peak below the prior peak. Higher lows belong to uptrends and lower highs belong to downtrends. When both appear together, price is coiling.
Is a higher low bullish?
Only once a higher high follows it. In an uptrend, it signals continuation. After a downtrend, the first higher low is only a possible reversal until price closes above the last lower high.
What is the 3-5-7 rule in trading?
It is a rule of thumb: risk no more than 3% per trade, keep total open risk at 5%, and aim for winners at least 7% larger than losers. Versions of the “7” differ, and no regulator sets these numbers.
What is the difference between a higher low and a lower high?
They measure different points. A higher low compares troughs and points to rising demand. A lower high compares peaks and points to weakening buying at the top.
How do you confirm a higher low?
Use a fixed pivot rule to identify the swing low. Check that it sits above the previous swing low. Then wait for a candle body to close above the previous swing high.
What happens when price breaks below a higher low?
A body close below it is a break of structure. The uptrend reading is invalid. It does not automatically start a downtrend, which needs its own lower high and lower low.
Does a higher low work in forex and crypto the same way as stocks?
The definition is the same. The difference is when the daily candle closes: stocks have gaps, forex closes at a broker-set hour, and crypto trades 24/7 with an exchange-defined daily close.
What timeframe should I use to find higher lows?
Start with the daily or weekly chart for direction, then use a shorter chart only to time an entry. Longer timeframes give fewer, more reliable swings.
Is there a higher high/lower low indicator on TradingView?
Yes. The built-in Pivot Points High Low indicator and many community scripts mark swing points. Their labels change with the left/right bar settings and appear only after the pivot completes.
Your next step: practice on a chart before you trade
Open a daily Bitcoin or S&P 500 chart and choose a 5-bar pivot rule. Label every swing from October 2025 to today, then mark where each higher low would have been confirmed and where each would have broken. Doing this with no money at risk shows you how late confirmation arrives and how often candidates fail. That is the best preparation before you size a real position.
Laws and regulations referenced
- IRS Notice 2014-21 (virtual currency is property)
- IRS Form 1099-DA, Digital Asset Proceeds From Broker Transactions
Links go to the official text on government sites.
Check, verify or complain
Sources
- FINRA Regulatory Notice 26-10: FINRA Adopts New Intraday Margin Standards to Replace the Day Trading Margin Requirements finra.org · official source
- FINRA Regulatory Notice 26-11 finra.org · official source
- FINRA Regulatory Notice 26-11 finra.org · official source
- FINRA Ends the Pattern Day Trader Rule acaglobal.com
- Pattern Day Trader Rule Eliminated 2026 stocktitan.net
- PDT Rule 2026 cmelitegroup.com
- Retail Day Trading is an Uphill Battle quantpedia.com
- Day Trading for a Living? (Chague, De-Losso, Giovannetti) econpapers.repec.org
- Bitcoin Drawdown chartrow.com
- Bitcoin sits 32% below its $126,000 record one year later cryptobriefing.com
- Bitcoin sits 32% below its $126,000 record one year later (TradingView News) tradingview.com
- Bitcoin drawdown much less dramatic this cycle: Fidelity cointelegraph.com
- Bitcoin: One More Flush Before The Bottom blofin.com
- 3-5-7 Rule in Trading: Everything Traders Should Know metrotrade.com
- Higher Low therighttrader.com

Owen explains how crypto works for US readers: coins and tokens, buying and selling, wallets and self-custody, staking and DeFi. He sticks to how things work and what they cost, never price calls, and checks platform fees and licensing against the companies' own disclosures.
Ruth is US Financer's standards editor. Every article goes through her checks before and after it is published: each rate, fee, cap, deadline and rule is matched against its primary source, every law named is linked to its official text, and anything that cannot be…
What changed
- Nov 13, 2026 First published.
Comments are closed